 SEO
A free website audit shows you, in a couple of minutes, what is slowing your website down, which technical SEO problems are holding it back in Google and what stops visitors from turning into customers. This guide explains what Webbily’s Free Website Audit & Performance Analyzer checks, how to read every score and metric, the issues it finds most often and exactly how to fix them — with real before-and-after results from sites we have repaired.
Key takeaways
- A website audit tests speed, Core Web Vitals, technical SEO, accessibility, mobile experience and best practices in one scan.
- Webbily’s audit uses Google’s own Lighthouse engine through PageSpeed Insights plus a real crawl of up to five pages of your site.
- Scores of 90–100 are good, 50–89 need improvement and 0–49 are poor; the three Core Web Vitals are LCP, INP and CLS.
- Most problems come from a short list: heavy images, render-blocking files, layout shifts, missing headings, meta data and canonical tags.
- Fixing them is measurable — we took one site’s mobile score from 78 to 98 and its main image load from 4.7 s to 1.0 s.
What is a free website audit?
A website audit is a structured health check of your site. Instead of guessing why your pages feel slow or why a competitor outranks you, an audit measures your pages against the same standards search engines and browsers use, then lists what to fix in priority order.
A good audit answers four questions every business owner should be able to answer about their website:
- Is it fast? Pages that take more than a few seconds to show their main content lose visitors, especially on phones.
- Can search engines understand it? Titles, descriptions, headings, canonical tags, sitemaps and structured data tell Google and Bing what each page is about.
- Can everyone use it? Readable contrast, image descriptions and labelled buttons help visitors with disabilities — and they are also quality signals.
- Is it built properly? HTTPS, clean redirects and a site free of browser errors protect both visitors and your reputation.
Google’s own SEO Starter Guide puts it simply: build pages for people first, then make sure search engines can find and understand them. An audit is how you check the second half of that sentence.
What the Free Website Audit & Performance Analyzer checks
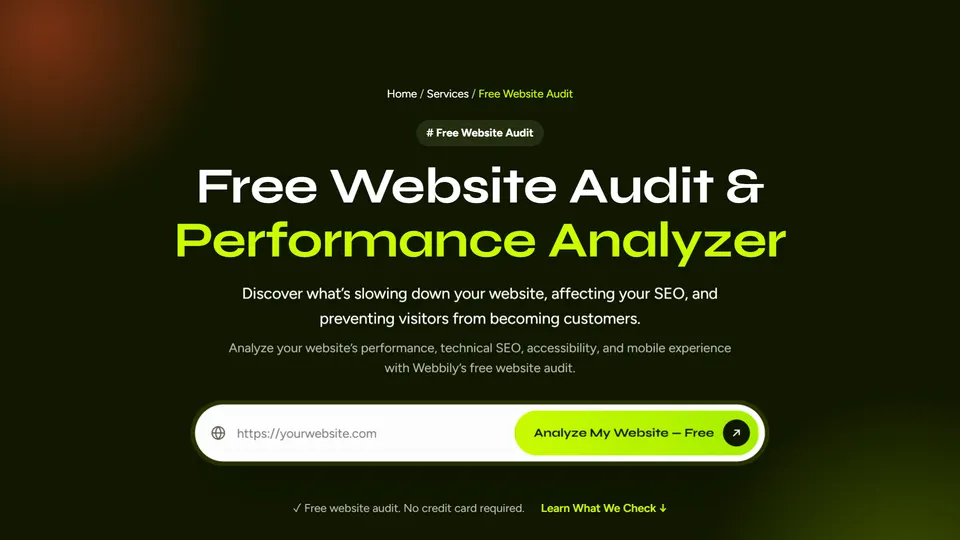
Enter your address on the Free Website Audit page and the analyzer runs three tests side by side: a mobile Lighthouse test, a desktop Lighthouse test and a technical SEO crawl of your pages. You get one report with every result, a shareable link and a downloadable PDF.
Speed and Core Web Vitals
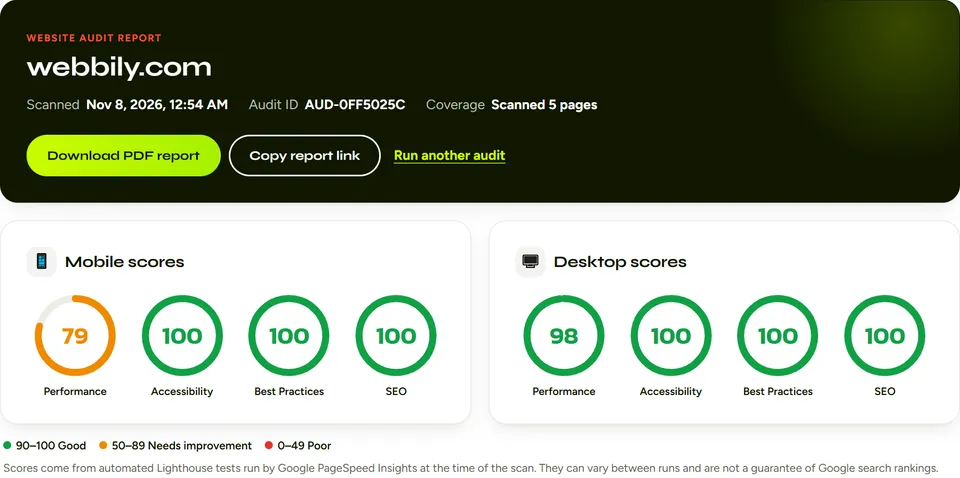
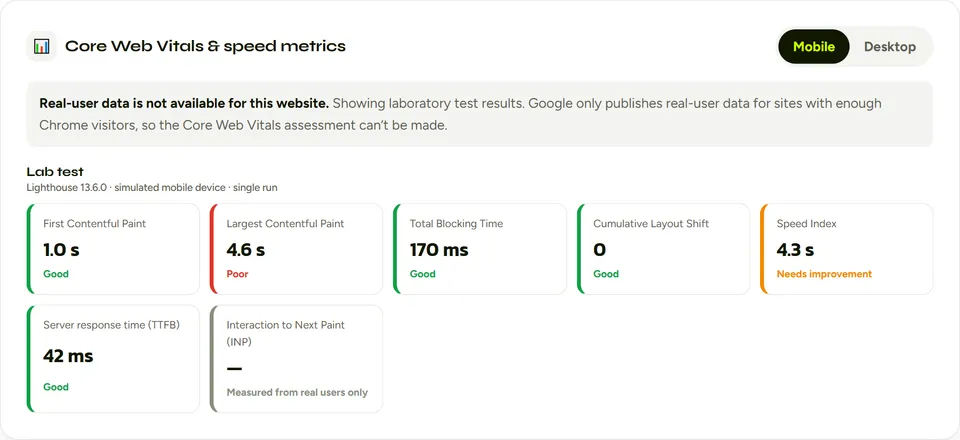
The performance score comes from Google PageSpeed Insights, which runs Lighthouse — the same audit engine built into Chrome. You see First Contentful Paint, Largest Contentful Paint, Total Blocking Time, Cumulative Layout Shift, Speed Index and server response time, plus real-visitor Core Web Vitals from Chrome users when Google has enough data for your site.
Technical SEO
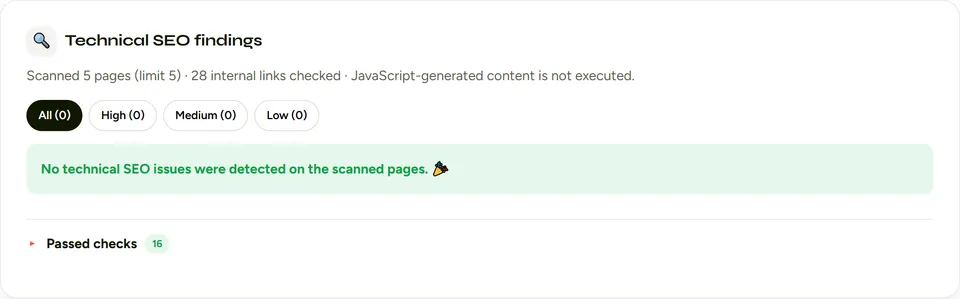
The SEO scan reads the actual HTML of up to five pages of your website and checks page titles, meta descriptions, headings, canonical tags, robots directives, robots.txt, your XML sitemap, structured data and broken internal links. Every finding comes with what we found, why it matters, how to fix it and the exact URLs affected.
Accessibility
Lighthouse’s accessibility checks look for low colour contrast, images without alt text, form fields without labels, buttons and links without names and headings that skip levels. These are the problems that make a site hard to use with a screen reader or on a bright phone screen outdoors.
Mobile experience
The mobile test simulates a mid-range phone on a slower mobile connection. Because most local searches now happen on phones, the mobile score is usually the one that matters most — and it is almost always lower than the desktop score. Our guide to mobile-first web design explains why.
Best practices
The best-practices category checks HTTPS, HTTP-to-HTTPS redirects, errors logged in the browser console, images shown at the wrong aspect ratio and other signs of a site that was not built or maintained carefully.
How to run a free website audit in 5 steps
- Open the analyzer. Go to webbily.com/website-audit — no account or credit card is needed.
- Enter your homepage address. Start with your homepage; it is usually the most visited page and the one search engines crawl first.
- Click “Analyze My Website — Free”. The three tests run in parallel and the progress steps show which one is still working. Most audits finish in one to two minutes.
- Read the report from the top down. Check the four scores first, then Core Web Vitals, then the speed opportunities, then the technical SEO findings filtered by severity.
- Save or share it. Download the PDF or copy the report link to send to your developer, your marketing team or to us for a free project assessment.
Run the audit again after every fix. Scores are measured fresh each time, so you can see the effect of each change instead of hoping it worked.
How to read your audit report
The four Lighthouse scores
Each category is scored from 0 to 100 using the bands Google publishes in its Lighthouse scoring documentation:
| Score | Colour | What it means |
|---|---|---|
| 90–100 | Green | Good — keep it there and re-check after big changes. |
| 50–89 | Orange | Needs improvement — real visitors are probably feeling it. |
| 0–49 | Red | Poor — fix these first; they are likely costing you traffic and sales. |
Core Web Vitals thresholds
Core Web Vitals are the three user-experience measurements Google uses in its page experience signals. Each has a “good” target measured at the 75th percentile of visits:
| Metric | Measures | Good | Poor |
|---|---|---|---|
| Largest Contentful Paint (LCP) | How fast the main content appears | ≤ 2.5 s | > 4 s |
| Interaction to Next Paint (INP) | How quickly the page responds to taps and clicks | ≤ 200 ms | > 500 ms |
| Cumulative Layout Shift (CLS) | How much the page jumps around while loading | ≤ 0.1 | > 0.25 |
Lab data vs real-user data
The scores come from a lab test: one simulated visit in controlled conditions. Google also publishes field data — real visits from Chrome users collected in the Chrome UX Report over the previous 28 days. When your site has enough traffic, the report shows both. Small or new sites often have no field data yet; in that case the lab test is your best guide. INP can only be measured from real visitors, so it appears only when field data exists.
Why scores change between runs
Two audits of the same page a few minutes apart can differ by several points — network conditions, server load and third-party scripts vary on every run. Judge trends, not single numbers: if a page scores in the 90s three times and in the 70s once, the page is fine and the one run was unlucky. If it is consistently below 90, there is real work to do.
10 common website audit issues and how to fix them
After auditing and repairing many business websites, the same problems appear again and again. Here is what they mean and how we fix them:
- Oversized images: a 1–2 MB photo shown at phone width is the most common cause of a slow LCP. Resize images to the size they are displayed at, convert them to WebP and give every image
widthandheightattributes. - Render-blocking CSS and JavaScript: stylesheets and scripts in the page head must download before anything shows. Load non-essential styles later, move scripts to the end of the page or mark them
defer. - Hidden hero content: fade-in or slide-in animations on the first screen keep the main content invisible until scripts run. Remove entrance animations above the fold; keep them for sections further down.
- Layout shifts: images without dimensions, late-loading fonts and banners that appear after load push the page around. Reserve space for everything that loads late.
- Heavy third-party scripts: analytics, ads, chat widgets and payment scripts can block the main thread. Load the ones you need after the page is usable and remove the ones you don’t.
- Missing or multiple H1 headings: each page needs exactly one H1 that states its topic, followed by H2 and H3 headings in order without skipping levels.
- Weak titles and meta descriptions: missing, duplicated or overly long titles and descriptions waste your space in search results. Write a unique one for every page.
- No canonical tag: when the same page is reachable at several addresses, a canonical tag tells search engines which one to rank.
- Missing robots.txt, sitemap or structured data: these help search engines find every page and understand your business, products and FAQs.
- Accessibility gaps: low-contrast text, icon-only buttons without labels and links like “Read more” that don’t say where they go. Give every control a clear, descriptive name.
Real results: what fixing an audit looks like
Scores only matter if fixing them is achievable. These are real mobile results from websites we repaired using exactly the findings this audit reports:
| Website | Mobile performance | Main content (LCP) | What we fixed |
|---|---|---|---|
| webbily.com (static site) | 78 → 98 | 4.7 s → 1.0 s | WebP images, non-blocking fonts, canonical tags, structured data, heading order |
| invoiceror.com (WordPress + Elementor) | 58 → 85 | — | Removed 29 unused scripts per page, fixed headings, link names and the main landmark |
| A WooCommerce farm store (WordPress) | 68 → 92 | 9.8 s → 3.2 s | Removed hero animations, deferred scripts and ad tags, WebP hero, fixed a 24 px layout jump |
In every case accessibility, best practices and SEO also reached 100 or close to it, and the page looked the same afterwards — the fixes changed how the site loads, not how it looks.
Essential meta data and technical SEO checklist
Use this checklist alongside your audit report. It follows the structure Google recommends for well-ranked pages:
- URL slug: short, readable and containing the main keyword, for example
/free-website-auditrather than/page?id=123. - Title tag: roughly 50–60 characters with the main keyword near the front, so it isn’t cut off — see Google’s guide to title links.
- Meta description: about 150–160 characters that summarise the page and give a reason to click; Google explains how it uses snippets.
- One H1: a single main heading that matches the search intent of the page.
- H2–H4 hierarchy: H2s for main sections and H3s or H4s for sub-points, never skipping a level.
- Introduction that answers first: state the main point in the first two or three sentences — this is what appears in featured snippets and AI answers.
- Short paragraphs and lists: two or three sentences per paragraph, with bullet or numbered lists where they fit.
- Images with alt text: descriptive alt text and file names, correctly sized and compressed.
- Internal and external links: link to related pages on your own site and to authoritative sources, using descriptive anchor text.
- Structured data: Organization, LocalBusiness, Article, Product or FAQ markup in JSON-LD, as described in Google’s structured data introduction.
- Canonical tag: one self-referencing canonical URL on every indexable page.
- robots.txt and XML sitemap: a robots.txt file that points to your sitemap, submitted in Google Search Console.
- HTTPS and mobile: a valid certificate, every HTTP address redirecting to HTTPS and a layout that works at phone width.
- Readable contrast: text that meets the WCAG minimum contrast ratio of 4.5:1.
Content formats that perform best once your site is healthy
A fast, technically sound site is the foundation; content is what ranks on top of it. Different goals call for different formats:
- Long-form pillar guides (2,000–4,000 words): best for broad, competitive topics — they build topical authority and give you many internal-linking opportunities, like our custom business systems guide.
- How-to and step-by-step guides: ideal for high-intent questions and featured snippets, such as the five steps above.
- Listicles: scannable answers to common questions — “10 common issues” is a listicle.
- Comparison and cost pages: capture visitors who are close to buying, like our website and app development cost guide.
- Video and rich media: increase time on page and can rank in both video and standard results.
Planning content every week is time-consuming. Our SEO management service handles keyword research, publishing and monthly reporting for you.
Free audit vs other website checking tools
| Tool | Best for | Limits |
|---|---|---|
| Webbily Free Website Audit | One report with mobile and desktop Lighthouse scores, Core Web Vitals and a technical SEO crawl, plus a PDF to share | Scans up to five pages per audit; does not run your site’s JavaScript during the SEO crawl |
| Google PageSpeed Insights | Detailed speed diagnostics for a single URL | No site-wide SEO checks such as broken links, sitemap or canonical review |
| Google Search Console | Indexing status, search queries, clicks and real Core Web Vitals across your whole site | Requires verifying site ownership; data appears over days, not instantly |
| Lighthouse in Chrome DevTools | Developers testing a page on their own computer | Results depend on the tester’s computer and connection |
They work best together: use the free audit for a fast, shareable overview, then Search Console to track how fixes affect your search traffic over the following weeks.
When to ask an expert
Many findings — a missing meta description, an image without alt text — take minutes to fix yourself. Others need a developer: render-blocking scripts in a WordPress theme, layout shifts caused by a page builder or a slow server. If your mobile score stays below 90 after the simple fixes, or the report lists high-severity SEO issues, it is usually faster to have them fixed properly than to keep trying plugins.
Webbily fixes audit findings on WordPress, WooCommerce and custom websites, and builds new sites that score well from day one through our web development and e-commerce services. See our pricing for packages.
Frequently asked questions
Is the Webbily website audit really free?
Yes. The audit is free, needs no account or credit card and gives you the full report, a shareable link and a PDF download.
How long does a website audit take?
Most audits finish in one to two minutes. The mobile test is usually the slowest part because it simulates a phone on a slower connection.
What is a good PageSpeed score?
A Lighthouse score of 90–100 is good, 50–89 needs improvement and 0–49 is poor. Aim for 90 or above on mobile, where most visitors are.
Does a higher audit score improve my Google ranking?
Page experience, including Core Web Vitals, is one of many signals Google uses, and relevant, helpful content matters most. A better score won’t guarantee a ranking, but slow, broken or confusing pages lose visitors and make it harder to rank.
Why is my mobile score lower than my desktop score?
The mobile test simulates a mid-range phone with a slower processor and network, so heavy images and scripts cost far more time than on a desktop computer.
How often should I audit my website?
Run an audit after every redesign, plugin or theme update and new page template, and at least once a month to catch problems early.
Run your free website audit now
It takes one address and about two minutes. Analyze your website for free, then send us the report link if you would like the issues fixed — we will reply with a free project assessment and a fixed quote. Prefer to talk first? Contact the Webbily team.